Characterized by steady growth, the solar industry has celebrated several successes within the last 10 years. According to Jenya Meydbray, CEO of PV Evolution Labs (PVEL), global production has increased twenty-fold. While 20 gigawatts were recorded in 2010, the figure is already around 400 gigawatts today. In this article, we take a closer look at the challenges that such growth can bring. To counteract problems and create solutions, PVEL has created a Product Qualification Program (PQP), which produces a scorecard of the best-performing PV modules and manufacturers. Read more about this topic in our article here.
Rapid and uncontrolled growth poses new challenges for companies
Demand for solar power continues to rise steadily. Even the currently ongoing global pandemic cannot stop this demand. This growth poses numerous challenges for manufacturers. These include a degradation rate of >15% of the individual elements within the modules, as measured by PVEL, at a current rate of 100 million soldered cells per day. However, to be able to combat climate change, at least 1 billion cells per day must be achieved. After numerous tests, it was determined that the degradation rate for modules that have been in operation for only 5 years, for example, and have also been exposed to particularly high heat, is higher on average than for older modules in cooler regions. Exawatt, a market intelligence provider and partner of PVEL, forecasts that more than 100 GW of new module production capacity will come online by the end of 2021. According to PVEL, a particularly big challenge will be not to neglect product quality in the long run, while manufacturers work on various innovations to avoid supply bottlenecks, for example. It can be assumed that, as a rule, new products will be manufactured in brand-new factories. Here, bills of materials (BOMs) are often passed on unchecked, which can have significant financial and safety consequences in the field. One particularly common error is complete equipment failure. Twenty six percent of the BOMs tested for this year’s scorecard had at least one failure. One in three manufacturers experienced a junction box failure of this type. Here, most of the failures occurred before testing began. Troubling junction box issues were first identified by PVEL in 2018.
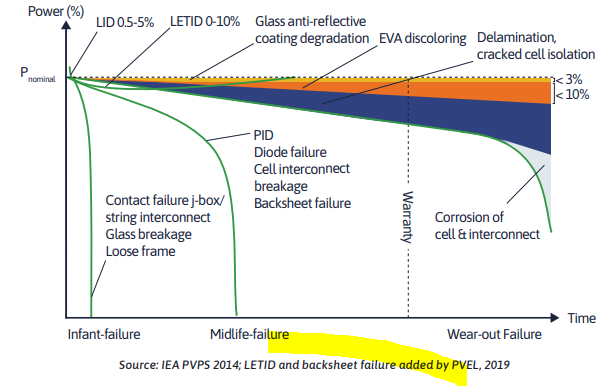
The following chart gives you an overview of the most common failure modes.
PVEL’s product qualification program can prevent failures
PVEL established a Product Qualification Program (PQP) for PV modules in 2012, which provides independent reliability and performance data through numerous testing procedures. In addition, this program recognizes individual manufacturers with particularly outstanding test results. The results are presented in so-called scorecard rankings. In contrast to previous editions, the rankings for 2021 contain considerably more field data that combine laboratory tests with real project applications.
Within the product qualification program, auditors check the production of the submitted modules. The respective parts lists are also checked here. After shipping, PVEL measures the power output and assesses the physical condition of each module before advanced reliability and performance testing can be performed. The following table summarizes the 4 essential procedures within the PQP.
| Empirical Data | No hand-picked samples | Standard samples | Regular program updates |
| The PQP provides empirical metrics for yield and energy output Modeling | Auditors observe production of all test samples and check BOMs. | The PQP audits all bills of materials in the same manner. This is done using calibrated equipment and in consistent test environments. | Updates to the test procedures provide data on new technologies and manufacturing techniques |
The 2021 Scorecard serves as a safeguard for developers, investors, and system owners against inadequate project performance. This summary is designed to encourage solar deployment and support the development of reliable, financeable solar projects. It shows the top performers for six PQP test categories. These performers are listed by model type and manufacturer in alphabetical order. To be eligible for the scorecard, manufacturers must meet several criteria. These include, for example, submitting at least two factory-tested PV module samples per test sequence. Bills of materials for all test sequences within PQP1 must also be complete.
To be among the top performers, companies must have a degradation rate of less than 2% after each reliability sequence.
Different tests within the program lead to better reliability
In order to be able to check the reliability of the individual modules, a number of tests were carried out. One of these is thermal cycling (TC). This humidity-heat test replicates degradation and failure mechanisms that can occur in the field. It exposes the modules to a constant temperature of 85 °C and relative humidity of 85 % in a climate chamber for a total of two times 1,000 hours – twice as long as required for IEC certification. The combination of high heat and intense humidity stresses the PV module layers. Here, monocrystalline wafers and cells with passivated emitter and back contacts (PERC) show stronger TC performance than multicrystalline wafers.
For multi-busbar (MBB) modules, improper soldering can lead to poor TC results. Three-busbar, four-busbar, and five-busbar modules have performed better on average in TC than MBB modules to date.
In addition, TC results for bifacial modules showed that both glass/glass and glass/rear modules achieved the top performer status, with front and rear performance drops similar to the performance drop. In general, micro-cracks can form in PV cells under excessive thermal and mechanical stress.
The following influences can cause damage to individual modules:
- Soldering of cells
- Laminating and other module manufacturing processes
- Temperature fluctuations (wind, snow, hail and other environmental conditions)
- Physical damage during transportation, installation or maintenance
When cracks restrict the flow of electricity through the cell, modules can produce less energy. Theycan also create hotspots and pose safety risks.
In addition to thermal cycling, tests that measure potential-induced power (PID) degradation in crystalline photovoltaic modules include. This degradation can occur within weeks or even days after different modules are put into operation. It occurs primarily when the internal PV circuit is negatively biased with respect to ground. Within the tests performed by PVEL, the module is placed in a climate chamber. In this climatic chamber, the bias voltage is applied equal to the maximum system voltage of the module (-1000 V or -1500 V) at 85 °C and 85% relative humidity for two cycles of 96 hours. These temperature, humidity, and bias conditions help evaluate potential deterioration and failure mechanisms associated with elevated leakage currents.
Further tests by PVEL deal with light-induced degradation (LID). LID generally refers to the rapid power loss caused by unstable boron-oxygen compounds. This power loss occurs when p-type crystalline modules are first exposed to sunlight. Within the PQP, a total of 17 samples will be tested for this power loss. All modules are placed outdoors and connected to an inverter to operate at the maximum power point. Meanwhile, they are exposed to immense light irradiation and lightning tests. This is done until stability is achieved according to IEC 61215:2016. To measure the degradation (LETID), two of the post-LID modules are placed in a climate chamber at 75 °C while connected to a power supply. Here, they are injected with a low current for 486 hours, with characterization every 162 hours. This simulates module operation at full solar irradiance and at maximum power. The test conditions are designed to slowly approach maximum degradation to avoid triggering additional degradation mechanisms.
To make predictions about the performance of PV projects, PVEL uses the industry-standard modeling program PVsyst. Here, PAN files model the irradiance- and temperature-dependent behavior of PV modules.
The program tests three identical PV modules over a matrix of IEC 61853-1 operating conditions, ranging in irradiance from 100 W/m2 to 1100 W/m2 and temperature from 15 °C to 75 °C. A user-defined PAN file is then created using PVsyst’s model parameters.
To better illustrate the performance of optimized PAN files, each PAN report includes two site simulation results: a 1 MW site in a temperate climate at 0° slope (in Boston, USA) and a 1 MW site in a desert climate at 20° slope (in Las Vegas, USA).
Widespread reports of backsheet failures in field modules have led PVEL to introduce the Backsheet Durability Sequence (BDS) within the PQP. Here, participants must select which BOMs are relevant to this test. Additionally, it is important to note that less than 10% of commercially available backsheet models have completed the BDS testing. After the module certification test, manufacturers are free to use any of the 100+ back models on the market in commercially available products. Some will suffer failures, and it is well documented that certification tests do not identify failure-prone backsheets. Specifying PQP-tested BOMs with strong BDS results helps ensure that backsheets and modules perform as expected.
PVEL recognizes manufacturers who have demonstrated a commitment to product quality and reliability and have achieved Top Performer status.
After numerous tests, PVEL recognizes manufacturers that meet all expectations as Top Performers. The following tabular listing shows the Top Performers and their respective performance histories from PVEL’s first scorecard in 2014 to the present. Manufacturers are listed alphabetically by the number of years they have been recognized as a top performer.

Conclusion
Advancing climate change is forcing some companies to set new goals to be able to generate renewable energy. For this reason, solar power will continue to maintain its relevance and thus grow steadilyin the coming years. However, every growth also involves risks. Especially when rapid growth takes place. Manufacturers have to react and thus produce products as quickly as possible using a wide variety of the latest technology. As we have discovered, errors can occur at various points within such productions. In order to keep errors as small as possible, some elaborate tests must be carried out in advance. In most cases, manufacturers lack the time and capacity to carry out such tests or inspections properly. PVEL’s product qualification program is a good solution to give customers more security for their purchases.
References
Tara Doyl, Ryan Desharnais, Tristan Erion-Lorico; 2021 PV Module Reliability Scorecard; 2021; https://modulescorecard.pvel.com/wp-content/uploads/2021-PV-Module-Reliability-Scorecard_May-27-21.pdf