There has been a major shift in designs and formats of PV modules leading to big jumps in power ratings and subsequently higher energy yields and lower project costs. Manufacturers have been announcing modules with power ratings of more than 500W or even 600W.
As an example, let us take a closer look at the new technologies that are wrapped up in Canadian Solar’s new Series 7 modules, designed to reduce the LCOE for solar plants and set the stage for global grid parity. With power ratings up to 665 W, Series 7 modules open the door to further optimizations at several levels, promising lower LCOE and a higher return on investment without creating additional challenges for installers or components suppliers.
This new module’s power reaches up to 665 W and provides an efficiency of up to 21.4%. These two things combined bring lower LCoE and BOS costs, making this module a cost-effective product for utility power plants.
Other great features include:
- CSAR (Canadian Solar Advanced Regeneration) Technology provides up to 50% lower initial degradation
- Compatibility with mainstream inverters
- Compatibility with mainstream trackers
- 40% lower hotspot temperature
- A new frame design that minimizes microcrack impact
- Heavy snow load up to 5400 Pa
- Unique CSIR (Canadian Solar Infrared Ray) Technology prevents hotspot risk originated from localized leakage current at the cell level
- Unique CSI Hetero Type Ribbon and Paving technology increases power, efficiency, and resistance to microcracks
- Better low irradiance performance provides a 0.5% higher energy yield
This new technology achieves lower LCoE by:
- High energy generation due to lower degradation and higher energy generation at low radiation.
- High reliability (product warranty, output warranty, low LeTID, excellent hotspot prevention and performance, and bankability) that gives access to lower cost of capital.
- Lower BoS costs and Capex (more power per string, less string cables, less string cables labor, lower modules installation costs, and lower tracker costs).

Impacts of Larger, More Powerful Solar Panels
The main PV panel type used in the utility solar panel industry has been the 72-cell form factor. It has dominated the industry for about a decade. Mounting and electrical systems have been optimized around it. The entire ecosystem (from development to BOS to construction) has been designed around it.
However, we have recently seen a shift away from the 72-cell module. It has now been replaced by half-cell or shingled bifacial panels in different form factors and increasing in size. This move brings both benefits and risks.
In recent years we have seen an increase in module power and efficiency but also in module size. New modules come in different forms. Some are increased in length, others in width, and yet others in both length and width. This makes it more difficult for developers and EPCs to run analyses and understand what the implications may be on their projects.

System Levels Benefits and Trade-Offs
- Module Installation
- Installation unit cost increased due to productivity loss from bigger/heavier modules. As the modules are heavier, the cost to install a panel increases simply because people installing it get tired faster. Some installers have seen a very marginal impact, while others have seen up to 20% difference depending on the size and weight of the module.
- Overall net positive due to lower module count. The installation cost of one unit can be offset, and the overall installation cost can benefit from a bigger form factor due to a drastic reduction in the total number of modules.
- Electrical BOS Impacts
- The cost of DC hardware is subject to the length of the string. Larger modules have higher power but also VOC, which allows for string length to remain the same. That means that the string power increases, resulting in a lower string count, which in turn generates savings in DC hardware, combiner boxes, cable cost, installation cost, and so forth.
- Potentially, some hardware optimization for higher current may be required by string inverter manufacturers.
- Shipping Benefits
- Higher shipping density leads to a reduction in the shipping cost. That, of course, depends on the exact size of the modules and how many of them a manufacturer can pack into one 40ft container.
Mechanical Impacts
- Having a bigger module increases the loads on the tracker. Wind loads on the racking increase due to bigger “sail area” and heavier modules. This may lead to an increase of steel in the tracker, thus increasing racking costs. There may also be a need to shorten the tracker or reduce the number of rows, decreasing the total tracker power. For most trackers, increasing module width is preferable as opposed to module length in order to reduce the force on torque tube components.
- Due to the higher weight of modules, tracker foundations may need to be upsized both in steel thickness and in length.
- An increase in pile loading leads to an increase in pile length, which leads to an increase in material, which may potentially lead to a higher installation cost.
- The published maximum tracker wind speed on datasheets was based on traditional 72-cell modules. It may, therefore, be inadequate for larger form factors.
- We may also see a reduction in the number of tables per tracker which will increase the overall cost of the tracker.
- It is also important to remember that the optimal string length for wider modules may not exceed the maximum allowable tracker length.
The above impacts and changes are manageable but require strong coordination with racking vendors.
Summary
Are larger form factor modules and higher-power modules good for a project? The general answer is yes. We see a net positive impact on project LCoE. Benefits vary from project to project, and some impacts are positive, and some are negative. The magnitude of both the positive and negative impacts depends on the module and tracker being considered and the project specifics. Therefore, a careful assessment of the impact on mechanical and electrical BOS and installation needs to be conducted on a project-specific basis.
Moreover, there are some areas that need to be further studied. Questions that still need to be answered include:
- Do larger modules endure more stress during shipping, installation, and operation, causing PV modules reliability concerns (such as microcracks)?
- Does the change of module weight and the wind loads on the tracker change the dynamic behavior of the tracker itself?
As the PV industry continues to move towards larger form factor modules, the careful qualification and selection of compatible, high-performance, high-reliability PV modules become more critical than ever before.
Is Bigger Always Better – Example Case Studies
Case Study 1: 50MW 2P Tracker (Vietnam)
In this case study, we are comparing the SunPower Performance 5 545W module with a conventional 500W bifacial module.

The larger form factor of P5 545W provides significant tracker supply savings. There is a slight penalty due to the long module. The savings are derived from approximately 5 km less tracker length (or about 10% less tracker steel). We also see significant savings in indirect costs (Time On Site Savings). The large reduction in the number of modules, the much-reduced tracker length, quantities, and piles means that the site construction time and the associated cost of blue- and white-collar labor are significantly reduced. Overall, we see an equivalent of the BOS savings of 1.96 US c/W using SunPower Performance P5-545.
Case Study 2: 5MW 1P Tracker (Australia)
In this case, we are comparing the SunPower Performance 5 635W module with a conventional 500W bifacial module.
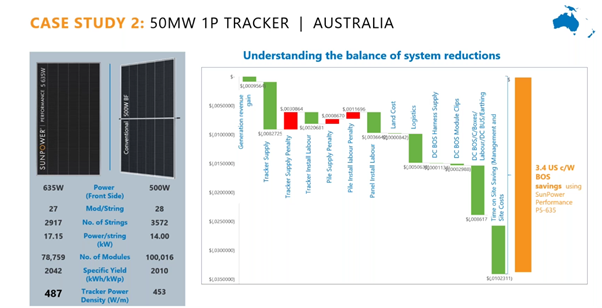
The number of modules per string is lower, and there is a huge significance in the number of strings. As a result of the higher power of each module, the power per string is higher, and there is a huge reduction in the number of modules for the whole site and a good advantage in terms of tracker power density (W/m).
There are tracker supply, pile supply, and installation penalties. Overall, though, there is a net saving from the mechanical perspective and significant gains made with DC Balance of System costs and Time On Site Saving. The overall BOS savings equal 3.4 US c/W using SunPower Performance P5-635.
Case Study: 50MW Summaries
Spain (2P Tracker)
| Conv 500W Bifacial | SPR-P5-545 | SPR-P5-635 | |
| Yield kWh/kWp | 2234 | 2256 | 2256 |
| BOS Savings (€c/Wp) | 1.56 | 2.46 | |
| BOS Savings (%) | 3.1% | 4.9% | |
| LCoE | -3.7% | -5.3% | |
| ROI | 14.62% | 15.24% | 15.53% |
| IRR | 13.52% | 14.20% | 14.51% |
| Assumption Metric | Value |
| Estimated EPC Cost | €0.50/W |
| Discount Rate | 6% |
| Inflation Rate | 1% |
| PPA Rate €/MWh | 35.07 |
| Spot Market Rate €/MWh | 35.07 |
| PPA Term | 12 yrs |
| Estimated Opex Cost | €4,250/MWp/Yr |
| Opex Annual Escalation | 1% |
Vietnam (2P Tracker)
| Conv 500W Bifacial | SPR-P5-545 | SPR-P5-635 | |
| Yield kWh/kWp | 2010 | 2048 | 2048 |
| BOS Savings (€c/Wp) | 1.96 | 2.98 | |
| BOS Savings (%) | 3.4% | 5.2% | |
| LCoE | -4.8% | -6.4% | |
| ROI | 23.64% | 24.97% | 25.44% |
| IRR | 22.81% | 24.19% | 24.68% |
| Assumption Metric | Value |
| Estimated EPC Cost | €0.57/W |
| Discount Rate | 10% |
| Inflation Rate | 1.5% |
| PPA Rate €/MWh | 70.90 |
| Spot Market Rate €/MWh | 25.00 |
| PPA Term | 20 yrs |
| Estimated Opex Cost | $7,000/MWp/Yr |
| Opex Annual Escalation | 1% |
Malaysia (2P Fixed Tilt)
| Conv 500W Bifacial | SPR-P5-545 | SPR-P5-635 | |
| Yield kWh/kWp | 1537 | 1559 | 1559 |
| BOS Savings (€c/Wp) | 1.71 | 2.70 | |
| BOS Savings (%) | 3.1% | 4.9% | |
| LCoE | -4.3% | -6.0% | |
| ROI | 9.76% | 10.22% | 10.41% |
| IRR | 7.96% | 8.52% | 8.76% |
| Assumption Metric | Value |
| Estimated EPC Cost | $0.55/W |
| Discount Rate | 7% |
| Inflation Rate | 3.0% |
| PPA Rate €/MWh | 36.14 |
| Spot Market Rate €/MWh | 36.14 |
| PPA Term | 21 yrs |
| Estimated Opex Cost | €2,400/MWp/Yr |
| Opex Annual Escalation | 1% |
Australia (1P Tracker)
| Conv 500W Bifacial | SPR-P5-545 | SPR-P5-635 | |
| Yield kWh/kWp | 2065 | 2089 | 2089 |
| BOS Savings (€c/Wp) | 2.17 | 3.42 | |
| BOS Savings (%) | 3.1% | 4.9% | |
| LCoE | -3.8% | -5.4% | |
| ROI | 10.72% | 11.21% | 11.42% |
| IRR | 9.03% | 9.60% | 9.85% |
| Assumption Metric | Value |
| Estimated EPC Cost | $0.70/W |
| Discount Rate | 8% |
| Inflation Rate | 3.0% |
| PPA Rate €/MWh | 39.85 |
| Spot Market Rate €/MWh | 39.85 |
| PPA Term | 12 yrs |
| Estimated Opex Cost | $8,000/MWp/Yr |
| Opex Annual Escalation | 1% |
Conclusion
Large form factor modules drive the BOS costs down by:
- More power per module – less overall DC Strings
- Reduced tracker quantities and piles (in most cases)
- Reduced logistical movements
- Reduced time on site (due to fewer modules and trackers to install)
However, it is important to remember that the level of BOS savings depends on:
- Individual assessment of each project site
- Tracker, BOS, and Inverter full compatibility check
- Assessment of electrical losses
- OH&S
Large modules mean more force and movement. Therefore, the reliability and durability of the used modules are crucial.